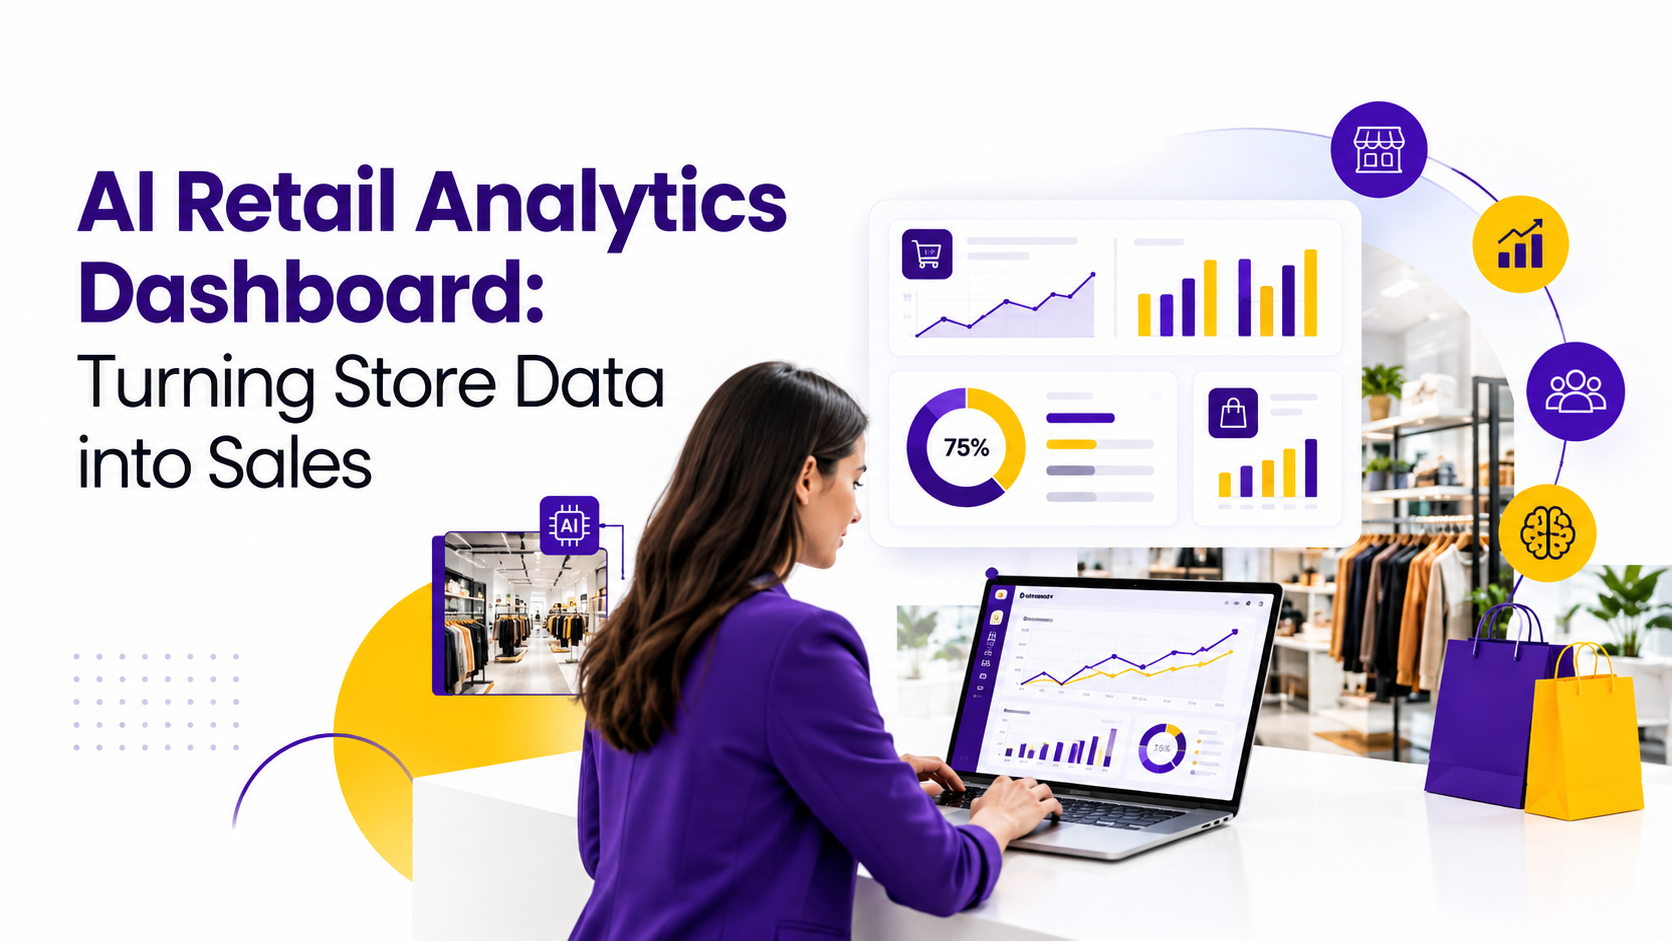

Most retailers already have the data. What they do not have is a fast, reliable way to turn that data into a decision before the moment passes. A shopper walks out without buying, a shelf sits empty for six hours, a promotion underperforms for two weeks before anyone notices. An AI retail analytics dashboard closes that gap by pulling sales, inventory, footfall, and customer data into one screen and telling you what to do next, not just what already happened.
The shift is happening fast. The global AI in retail market is projected to grow from 12.40 billion USD in 2025 to 105.88 billion USD by 2034, and predictive analytics alone is expected to hold the largest share of that spending in 2026. This guide breaks down what an AI retail analytics dashboard actually does, what it costs to build one, and how to avoid the mistakes that turn a promising project into an expensive dashboard nobody opens.
What Is an AI Retail Analytics Dashboard, Really?
Strip away the marketing language and an AI retail analytics software platform does three things. It pulls data from your point of sale, inventory, ecommerce, and customer systems into one place. It applies machine learning models to spot patterns a person would miss or take weeks to find manually. And it presents the output as something a store manager or a founder can act on in minutes, not a report an analyst has to interpret first.
That last part is where most legacy business intelligence tools fall short. They show you last month's numbers in a nicely formatted chart. A proper AI retail analytics dashboard shows you what is likely to happen next week and flags the specific action that changes the outcome, whether that is reordering a fast moving SKU or adjusting a price before a competitor undercuts you.
Why Retailers Are Investing in This Now
Three things changed at the same time. Cloud data infrastructure got cheap enough for mid sized retailers to afford. Machine learning models got good enough to run on messy, real world retail data instead of clean lab datasets. And customer patience got shorter, which means a slow reaction to a stockout or a mispriced item costs more than it used to.
• The global retail analytics market is projected to grow from 11.31 billion USD in 2026 to 20.65 billion USD by 2031, a compound annual growth rate of 12.8 percent.
• Big data analytics spending inside retail specifically is expected to climb from 17.74 billion USD in 2026 to 94.15 billion USD by 2034, driven largely by real time inventory and pricing use cases.
• Predictive analytics, the part of the market that powers demand forecasting and personalization, is expected to hold the single largest share of AI retail spending in 2026.
• Retailers running on spreadsheets and static reports are increasingly the exception, not the norm, among chains competing on price and availability.
None of this means every retailer needs a custom built platform on day one. But it does mean the gap between retailers using an AI retail analytics dashboard and those still exporting CSV files every Monday morning is widening every quarter, and it shows up directly in margin and stockout rates.
What a Modern Dashboard Actually Tracks
The word dashboard covers a lot of ground. Here is what separates a basic sales report from a genuine AI retail analytics dashboard built to drive revenue decisions.
How Store Data Becomes an Actual Sale
It helps to see the full path data takes before it turns into a decision that affects revenue. Here is the process most well built platforms follow.
1. Data collection across every channel
Point of sale transactions, ecommerce orders, warehouse and inventory management systems, loyalty program activity, and sometimes in store footfall sensors all feed into a central data layer.
2. Cleaning and unification
Product names, SKUs, and customer records rarely match perfectly across systems. This step reconciles them so the same shopper or product is not counted twice under two different labels.
3. Model training on historical patterns
Machine learning models learn from months or years of past sales, seasonality, and promotion performance to understand what normally drives demand up or down.
4. Prediction and anomaly detection
The system flags what is about to happen. A specific store location trending toward a stockout, a product category losing momentum, a customer segment showing early churn signals.
5. Recommendation and action
Instead of a raw chart, the dashboard surfaces a specific instruction. Reorder this SKU by Thursday. Drop this price by 8 percent. Push this promotion to this customer segment.
6. Feedback loop
Once a recommendation is acted on or ignored, the outcome feeds back into the model, so accuracy improves the longer the system runs.
Where the Revenue Impact Actually Shows Up
Founders evaluating an AI retail analytics dashboard usually want to know where the return actually comes from. It rarely comes from one dramatic feature. It comes from several smaller, compounding improvements.
• Demand forecasting: fewer emergency reorders and fewer markdowns on overstocked items, because purchasing decisions are based on predicted demand instead of last month's average.
• Dynamic pricing: prices adjust to real demand and competitor movement instead of sitting static for weeks, which protects margin during slow periods and captures more during high demand windows.
• Personalization and targeting: promotions go to the customer segments most likely to respond, instead of being blasted to an entire list at a flat discount rate.
• Footfall and store layout analytics: in store sensor and camera data show which areas of a store convert browsers into buyers, informing layout and staffing decisions.
• Fraud and shrink detection: unusual transaction or return patterns get flagged automatically instead of surfacing months later during a stock audit.
The AI in retail market's shift toward predictive analytics is not accidental. Retailers that adopt AI driven analytics report meaningfully better inventory accuracy and fewer missed sales from stockouts, which is exactly why the global AI in retail market is projected to reach 40.74 billion USD by 2030, growing at a 23 percent compound annual rate.
None of these gains happen automatically the moment a dashboard goes live. Each one depends on someone actually reviewing the recommendation and acting on it within a reasonable window. A demand forecast that flags a stockout three days in advance is only useful if purchasing gets notified in time to place the order, which is why the interface and alert routing usually matter as much as the accuracy of the underlying model.
Which Retail Formats Gain the Most
Not every retail business needs the same depth of AI retail analytics software. The value shows up differently depending on what you sell and how fast your inventory turns over.
• Grocery and convenience: perishable inventory means even small forecasting errors turn into waste. Demand prediction and automated reorder alerts usually deliver the fastest payback in this category.
• Fashion and apparel: size, color, and seasonal trend data change constantly. Dashboards that track sell through rate by variant help avoid markdown heavy end of season clearance cycles.
• Electronics and appliances: slower moving, higher value inventory benefits most from dynamic pricing and competitor price tracking, since a few dollars of margin per unit adds up at scale.
• Quick commerce and delivery: footfall data matters less than fulfillment speed data. These businesses lean heavily on real time stock accuracy across multiple dark stores or micro warehouses.
• Multi brand retail chains: benefit most from a centralized dashboard that compares performance across locations, since manual comparison across dozens of stores is where human analysis breaks down fastest.
If you operate across more than one of these categories, the dashboard needs to be flexible enough to weight different signals for different product lines. A single fixed model rarely performs well across grocery and electronics at the same time.
Data Sources and Integration Requirements
The quality of an AI retail analytics dashboard is limited by the quality of the data feeding it. Before evaluating vendors or developers, it helps to know exactly what systems need to connect and how.
Most delays in these projects trace back to this stage, not the machine learning work itself. Legacy point of sale systems in particular can lack modern APIs, which means a developer sometimes has to build a custom connector before any model training can begin. Confirming what your current systems support before signing a contract avoids a common source of budget overruns.
Off the Shelf Platform or Custom Build
This is the decision most founders get stuck on, and there is no single right answer. It depends on how standard your operations are and how much of your competitive edge depends on data you cannot get from a generic tool.
If your operation runs on fairly standard retail workflows, a subscription platform gets you moving faster and cheaper. If your competitive advantage depends on proprietary data, unusual store formats, or integration with systems a generic tool was never built to handle, working with an AI Retail Development Company that builds around your actual operation tends to pay off within the first year or two.
Questions worth asking before you commit either way
☐ Does the platform integrate cleanly with our current POS and inventory systems, or will we need custom connectors?
☐ Who owns the historical data once we stop paying for the platform?
☐ Can the recommendation logic be adjusted for our specific product categories, or is it a fixed model?
☐ What happens to pricing as we add stores or transaction volume?
☐ Is there a clear rollback plan if the AI recommendations underperform in the first quarter?
When you do start comparing AI retail analytics dashboard development companies, resist the urge to decide based on the demo alone. Ask each one to walk through how they handled a messy, real world data migration for a past client, not just how the finished dashboard looks. The companies that can answer that question in detail are usually the ones that will still be useful six months after launch, once the initial excitement wears off and the actual data problems surface. A capable AI Retail Development Company will also be upfront about what a first version cannot do yet, rather than promising a fully autonomous system from day one.
What It Actually Costs in 2026
Cost depends heavily on scope, but here is a realistic range for founders budgeting a project this year. Quotes from AI retail analytics dashboard development companies tend to vary widely at this stage mainly because of how much custom integration work your existing systems require, so treat the ranges below as a starting point for conversation rather than a fixed number.
The line item founders most often forget is the last one. Machine learning models drift over time as customer behavior and market conditions change. A dashboard that performed well at launch can quietly lose accuracy within a year if nobody retrains it, so budget for maintenance from the start rather than treating it as a surprise.
Security and Compliance Considerations
An AI retail analytics dashboard touches customer purchase history, payment patterns, and sometimes in store camera footage, which puts it squarely inside data privacy regulations. This is worth planning for early rather than treating as a legal afterthought once the dashboard is already built.
• Confirm whether customer data used for personalization needs explicit consent under regulations like GDPR or CCPA, depending on where your customers are based.
• Ask how long raw transaction and footfall data is retained, and whether it can be deleted on request.
• Check if in store camera or sensor data is anonymized before it reaches the analytics layer, since raw footage carries a much higher compliance burden.
• Verify that role based access controls exist, so a store manager cannot see chain wide financial data they are not authorized to view.
• Ask whether the vendor or development partner has experience with payment card industry standards if the dashboard touches transaction level data directly.
Common Mistakes That Sink These Projects
What to watch for before and during the build
☐ Starting the build before data from POS, inventory, and ecommerce systems is actually clean and connected
☐ Choosing a vendor based on the flashiest dashboard demo instead of asking how the underlying models were trained
☐ Skipping a pilot phase and rolling the dashboard out to every store location at once
☐ Treating the launch as the finish line instead of budgeting time and money for retraining as data patterns shift
☐ Giving store managers a tool with no training on how to actually act on the recommendations it generates
The most common failure point is not the technology. It is rolling out to every location before confirming the recommendations actually hold up in one real store over a few weeks. A short pilot catches data quality problems and model tuning issues while the cost of being wrong is still small. A useful rollout usually moves through four stages: a discovery phase where data sources are audited, a pilot at one or two locations, a review period where accuracy is checked against actual outcomes, and only then a full rollout across every store. Skipping straight from discovery to full rollout is where most of the expensive mistakes happen, because a flawed model gets scaled before anyone catches the flaw.
Building the Right Team for This
An AI retail analytics dashboard worth using needs more than a general web developer. You typically need someone who understands data pipelines, someone who can build and tune the machine learning models, and someone who can turn model output into an interface a non technical store manager will actually open every morning.
• A data engineer to build reliable pipelines from your POS, inventory, and ecommerce systems into one clean data layer.
• A machine learning engineer to build and continuously retrain the forecasting and recommendation models.
• A frontend or product focused developer to keep the dashboard simple enough that a store manager uses it without a training manual.
Most retail businesses do not have this combination in house, and hiring three full time specialists for a single dashboard project rarely makes financial sense. This is usually where founders choose to Hire AI/ML Developers on a project or dedicated basis instead of building an internal team from scratch, since it gets the right expertise involved without the overhead of permanent hires for a project with a defined scope.
There is also a practical middle ground worth considering. Some businesses keep a small internal team to manage day to day operations and data governance, while choosing to Hire AI/ML Developers specifically for the initial model build and periodic retraining. This keeps long term costs predictable while still getting experienced hands on the parts of the project that are hardest to get right the first time, particularly the demand forecasting models where a poorly tuned system can do more harm than no system at all.
Measuring Whether It Is Actually Working
A dashboard is only worth what it changes. Track these numbers before and after launch instead of judging the project on how good the interface looks.
Signs Your Business Is Ready to Move Forward
Not every retail business is at the right stage for this investment yet. Before committing budget, it helps to check whether the basics are actually in place.
You are likely ready if most of these are true
☐ Your point of sale and inventory systems are digital and reasonably up to date, not paper based or heavily manual
☐ You have at least six months of consistent sales history to train initial forecasting models
☐ Someone on your team owns inventory and pricing decisions and can act on daily recommendations
☐ Stockouts, overstock, or slow pricing reactions are a known, recurring problem rather than a rare exception
☐ You are prepared to run a pilot at one location before committing to a full rollout
If two or three of these are missing, it usually makes more sense to fix the underlying data and process gaps first. An AI retail analytics dashboard built on top of inconsistent inventory records or disconnected systems tends to produce recommendations nobody trusts, which defeats the purpose before the project even gets off the ground.
Conclusion
None of this requires chasing every AI feature a vendor tries to sell you. The retailers seeing real results in 2026 picked one or two problems, stockouts, slow pricing decisions, or missed personalization, and built or bought a system that solved those specifically before expanding further.
An AI retail analytics dashboard earns its cost the moment it stops someone from reordering the wrong product or missing a pricing window that a competitor caught first. Start with a clear problem, get the data foundation right, and let the feature list grow from there instead of the other way around.