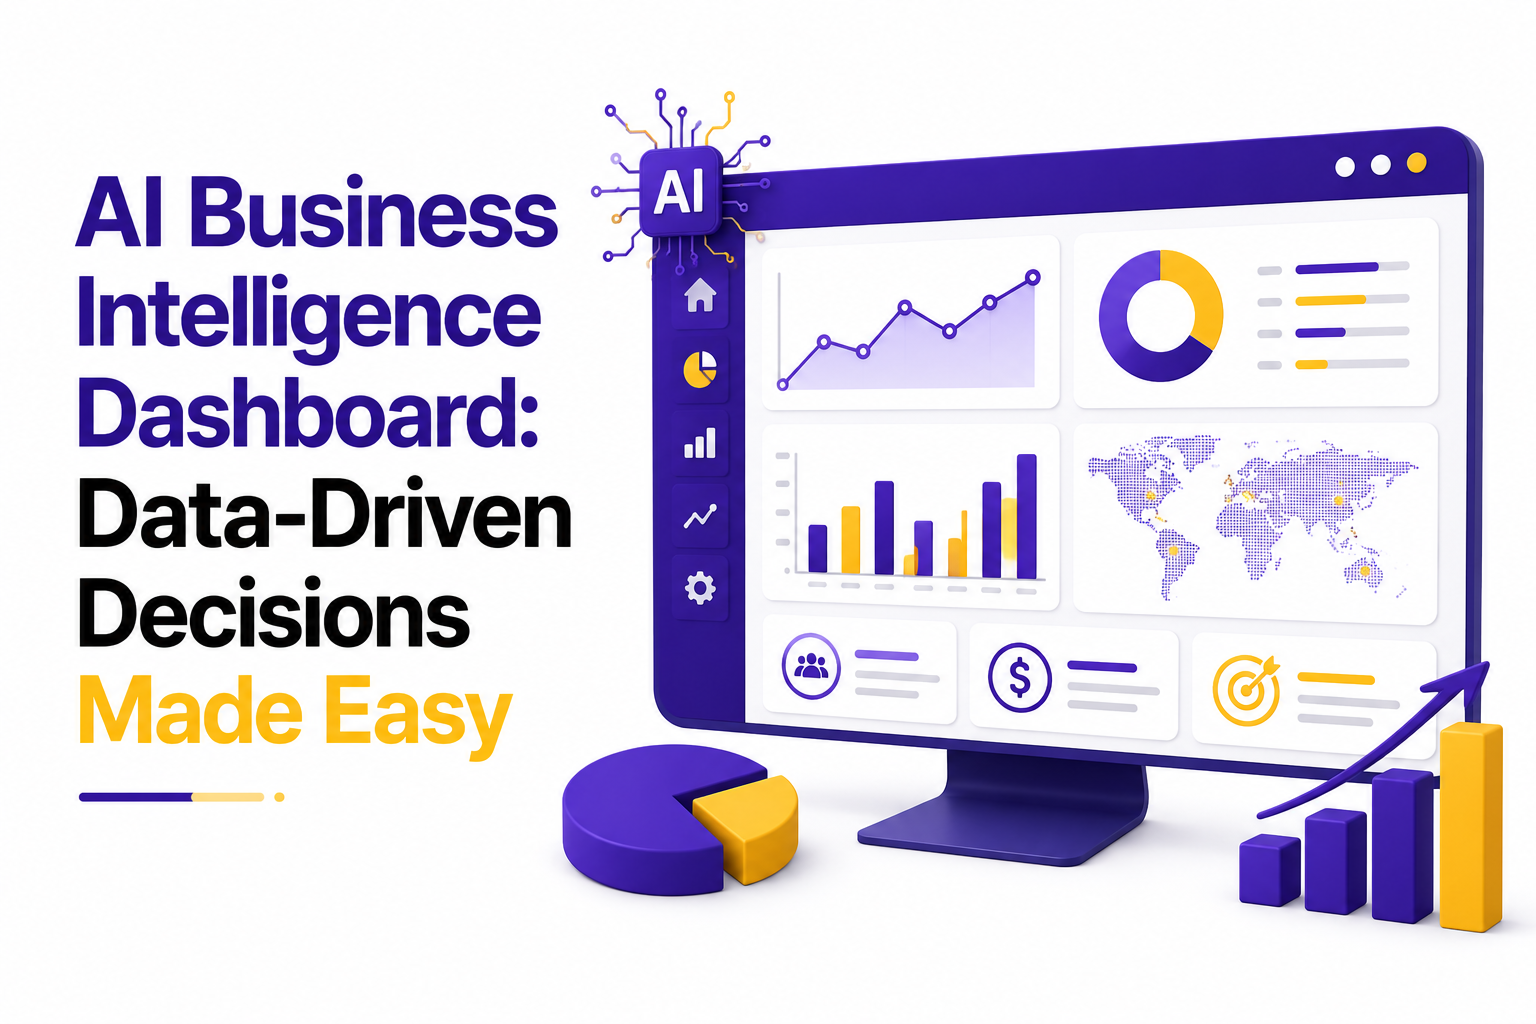

You already know your business generates more data than anyone has time to actually read. The real question in 2026 is not whether you need better reporting. It's whether your current setup can keep up with how fast decisions actually need to happen.
That's where an AI business intelligence dashboard changes things. Instead of static charts that are outdated the moment someone opens them, you get a system that spots patterns, flags anomalies, and points toward what happens next, not just what already happened.
This guide walks through what these dashboards really do, how they compare to the BI tools most teams grew up using, and what matters most whether you build one in-house or bring in outside help.
What Exactly Is an AI Business Intelligence Dashboard?
Let's cut through the buzzwords for a second.
An AI business intelligence dashboard is a visual reporting tool that uses machine learning and natural language processing to interpret data, not just display it. A traditional dashboard shows you numbers. This one explains them.
• A traditional dashboard shows a sales dip in March.
• An AI powered dashboard tells you the dip correlates with a pricing change in your top-performing region, and predicts it will continue into April unless something shifts.
That move from reporting to reasoning is really the whole point of AI BI software in 2026. It's not there to replace human judgment. It's there to remove the hours of manual digging that used to happen before anyone could make a confident call.
It also changes who gets to use the data in the first place. Traditionally, insight sat with whoever knew how to write a query or build a pivot table. A well built dashboard hands that same power to a marketing lead, an operations manager, or a founder who has never opened a database in their life. That's a bigger cultural shift than it sounds like on paper, because it changes how quickly a whole organization can move, not just how quickly one analyst can work.
Why 2026 Is a Turning Point for AI BI Software
Three shifts have made AI BI software genuinely practical for companies that aren't tech giants with in-house data science teams.
1. Natural language querying has become reliable enough that a non-technical founder can type a plain question like "why did churn spike last quarter" and get an actual answer, not just a chart with no context.
2. Predictive models that used to require a dedicated analytics team now come pre-trained directly into dashboard platforms, ready to use from day one.
3. Integration costs have dropped noticeably, because most modern tools connect to existing CRM, ERP, and finance software without months of custom development work.
None of this means the technology runs itself. It means the barrier to entry is much lower than it was two years ago, which is exactly why so many companies are shortlisting vendors and evaluating options right now instead of waiting another budget cycle.
Core Features to Look for in an AI Business Intelligence Dashboard
Not every tool that calls itself AI powered actually deserves the label. Here's what a genuinely capable AI business intelligence dashboard should include.
A dashboard that's missing more than one or two of these is probably still a traditional BI tool with an AI label attached for marketing purposes.
Which Industries Are Getting the Most Out of AI BI Software Right Now
Adoption isn't even across the board. Some industries are further along simply because their data is more structured or the cost of a slow decision is higher.
• Retail and eCommerce: pricing, inventory, and demand forecasting all change daily, so real-time updates matter more here than almost anywhere else.
• Financial Services: fraud detection and risk scoring benefit heavily from anomaly detection that would take a human team far too long to catch manually.
• Healthcare Administration: patient flow, staffing, and resource planning all rely on forecasting that used to be done with rough estimates instead of data.
• Logistics and Supply Chain: delays and disruptions ripple fast, so predictive alerts often save more money than the platform costs to run.
• SaaS and Subscription Businesses: churn prediction and usage pattern analysis are almost tailor made for what an AI powered dashboard does best.
If your industry isn't on this list, that doesn't mean the technology won't work for you. It just means you may need to be more deliberate about what specific use case justifies the investment first, rather than adopting a platform simply because competitors are talking about it.
AI BI Software vs Traditional BI Tools
It helps to see the differences side by side before you commit budget to either direction.
The honest takeaway is that traditional BI tools aren't obsolete. They still work fine for static reporting. But if your business needs to react quickly to changing conditions, the gap between the two approaches gets harder to ignore.
A useful way to think about it is that traditional BI answers questions you already knew to ask. An AI powered system also surfaces the questions you didn't think to ask in the first place, which is usually where the more expensive problems, and the more valuable opportunities, tend to hide.
How an AI Business Intelligence Dashboard Actually Works
Here's the process in plain terms, without the technical jargon.
4. Data Ingestion and Cleaning: the system pulls data from your connected sources and cleans up inconsistencies, duplicates, and formatting errors automatically.
5. Pattern Recognition: machine learning models scan historical data to identify trends, correlations, and recurring behaviors that would take a human analyst days to find manually.
6. Insight Generation: the system translates raw patterns into plain-language insights and highlights what deserves attention first.
7. Visualization Layer: charts, graphs, and summaries are generated automatically and updated as new data comes in.
8. Continuous Learning: the model keeps refining its predictions as more data flows through, so accuracy tends to improve the longer the system stays in use.
One thing worth setting expectations on early is accuracy. No model is perfectly right from the first day it goes live. Most platforms need somewhere between four and eight weeks of real usage before predictions start to feel reliable, simply because the model needs enough real examples from your own business to learn from. Teams that expect instant perfection tend to lose confidence in the system too early, right before it would have started proving useful.
Key Benefits for Decision-Makers
For CEOs and founders specifically, the appeal isn't the technology itself. It's what the technology frees you up to do.
• Faster decisions, because you're not waiting on someone to build a report before a meeting.
• Less dependency on a dedicated analyst for routine questions.
• Earlier warning on risks like churn spikes, cash flow issues, or supply delays.
• More accurate forecasting, since predictions are based on patterns rather than gut instinct alone.
• Wider access to data across teams, without giving up control over who sees what.
None of these benefits show up overnight. They compound over months as the system learns your business and your team gets comfortable trusting it.
Signs Your Business Is Ready for an AI Business Intelligence Dashboard
Not every company needs to make this move right now, and that's a fair thing to admit before spending budget on it. A few signals tend to show up consistently in businesses where the timing actually makes sense.
• Reports take days to prepare, and by the time they're ready, the numbers have already changed.
• Different teams pull conflicting numbers for the same metric because there's no single source of truth.
• Leadership finds out about problems, like a sales slowdown or a spike in support tickets, weeks after they started.
• Your data lives in five or six different tools that don't talk to each other.
• You're growing fast enough that manual reporting is starting to break under the pace of new data.
If two or more of these sound familiar, it's probably worth starting the conversation now rather than waiting for the problem to get more expensive to fix. The cost of delaying rarely shows up as a single dramatic event. It shows up quietly, as slower reactions and missed windows that are hard to trace back to any one decision.
Should You Build In-House or Hire AI Business Intelligence Dashboard Development Companies?
This is usually the point where the conversation gets stuck. Building in-house feels like more control. Hiring outside help feels faster. Both can be true, depending on your situation.
Signs You Might Be Better Off Working With AI Business Intelligence Dashboard Development Companies
• Your internal team doesn't have dedicated data science or machine learning expertise.
• You need something running in months, not a year or more.
• Your data sources are scattered across multiple systems that don't talk to each other well.
• You'd rather pay for expertise upfront than hire and train a full internal team.
Signs Building In-House Makes More Sense
• You already have data engineers and machine learning talent on staff.
• Your data infrastructure is already fairly clean and centralized.
• You expect to keep customizing the system heavily for years, which favors owning the code outright.
• Budget flexibility matters less to you than long-term control over the roadmap.
What Working With AI Business Intelligence Dashboard Development Companies Actually Involves
If you do decide to bring in outside expertise, it helps to know what the process usually looks like before you start comparing options.
9. Discovery and Scoping: understanding your current data setup, business goals, and what decisions the dashboard needs to support.
10. Prototype and Validation: building a working sample using a subset of your real data, so you can see actual output before committing to full development.
11. Integration: connecting the dashboard to your existing systems, which is usually the most time-consuming part of the whole project.
12. Testing and Refinement: checking accuracy, fixing edge cases, and making sure predictions hold up against real outcomes.
13. Handover and Training: getting your team comfortable using, and ideally maintaining, the system going forward.
Timelines vary a lot depending on data complexity, but a reasonable range for a functional first version is 10 to 16 weeks. Anyone promising a fully custom, enterprise-grade system in a week or two is probably cutting corners somewhere.
Questions to Ask Before You Choose a Platform or Vendor
Whether you're evaluating off-the-shelf software or comparing proposals from outside teams, the same core questions tend to separate a good fit from an expensive mistake.
• How is the model trained, and is it trained on data specific to my industry or generic data pulled from anywhere?
• What happens to our data if we cancel or switch providers down the line?
• How often are predictions retrained, and what triggers a retraining cycle?
• Can we start with one department or use case before rolling this out company-wide?
• What does support actually look like after launch, and is it included or billed separately?
• How does pricing change as our data volume or user count grows over time?
Getting straight answers to these questions upfront tends to reveal a lot about how a vendor operates, often more than the sales demo does. A vendor who answers clearly and specifically is usually one who has been through this conversation many times before, which is generally a good sign rather than a red flag.
Cost Factors to Budget For
Pricing for an AI business intelligence dashboard varies more than most first-time buyers expect, mostly because it depends on decisions you make along the way, not just the tool itself.
None of these numbers are fixed. They shift based on whether you're buying an existing platform, customizing one, or building fully custom software from scratch. Get at least two or three quotes before assuming any single number reflects the real market.
It's also worth budgeting for costs that rarely show up in a proposal, like the internal time your team spends cleaning data before launch, training staff to actually use the dashboard, and the inevitable adjustments once real usage reveals gaps the initial scoping missed. None of these are dealbreakers. They just tend to catch first-time buyers off guard when they weren't accounted for from the start.
Common Mistakes Companies Make
Most of these are avoidable, but they show up often enough to be worth calling out directly.
• Choosing a tool based on features alone, without checking how well it integrates with existing systems.
• Underestimating how messy internal data actually is before starting the project.
• Expecting the AI to be accurate on day one, before it's had time to learn from real usage.
• Skipping proper access controls, which creates security risk once more people start using the dashboard.
• Treating the dashboard as a one-time project instead of something that needs ongoing attention.
Most of these mistakes come down to moving too fast in the planning stage. A few extra weeks of scoping usually saves months of rework later. It's also worth having someone outside the immediate project, a finance lead or an operations head who wasn't involved in the vendor selection, sanity check the plan before signing anything. A fresh set of eyes tends to catch assumptions that everyone closer to the project stopped questioning weeks earlier.
What's Next: AI BI Software Trends Beyond 2026
A few directions are worth watching if you're planning a purchase that needs to hold up for the next few years.
• Voice-based querying is starting to show up alongside text-based natural language search.
• Cross-company benchmarking, where dashboards compare your metrics against anonymized industry data, is becoming more common.
• Tighter integration between BI dashboards and operational tools, so insights trigger actions automatically instead of just getting reported.
• Increased focus on explainability, since regulators and internal compliance teams increasingly want to know why an AI model reached a particular conclusion.
None of these are must-haves today. But if you're choosing a platform meant to last three to five years, it's worth asking vendors where their roadmap stands on each one. A tool that can't answer where it's headed on explainability or automation is one that's likely to feel dated well before your contract is up for renewal.
Getting Your Team to Actually Use It
Buying the right tool solves maybe half the problem. The other half is adoption, and it's the part most companies underplan for.
14. Start with one visible win. Pick a metric everyone already argues about, like which channel actually drives the most revenue, and let the dashboard settle it publicly.
15. Keep the first rollout narrow. Give access to one or two teams first instead of the whole company at once, so early confusion doesn't spread everywhere.
16. Assign an internal owner. Someone needs to be responsible for flagging issues, answering basic questions, and keeping the platform relationship going after the initial excitement fades.
17. Revisit usage after 60 days. Check who's actually logging in and using the insights, not just who attended the training session.
Tools that get shelved after launch almost always fail for this reason rather than a technical one. The software worked fine. Nobody built the habit of actually opening it.
Final Thoughts
There's no version of 2026 where slower decision-making becomes a competitive advantage. Every quarter, the gap widens between companies that can see what's happening in their business in real time and companies still waiting on someone to pull last month's numbers.
An AI business intelligence dashboard won't fix a broken business strategy. But it will stop you from finding out about problems weeks after they started, and it will free up the kind of thinking that spreadsheets have been quietly eating for years.
Whether you build the system in-house or work with specialists who do this daily, the honest first step is the same. Get clear on what decisions you actually need faster answers for, and work backward from there.
The companies that get the most value out of this shift in 2026 aren't necessarily the ones with the biggest budgets. They're the ones who treated the dashboard as a decision-making tool from day one, rather than a reporting upgrade nobody asked for. That distinction shapes almost everything else, from how the project gets scoped to how quickly the team actually starts trusting what it says.